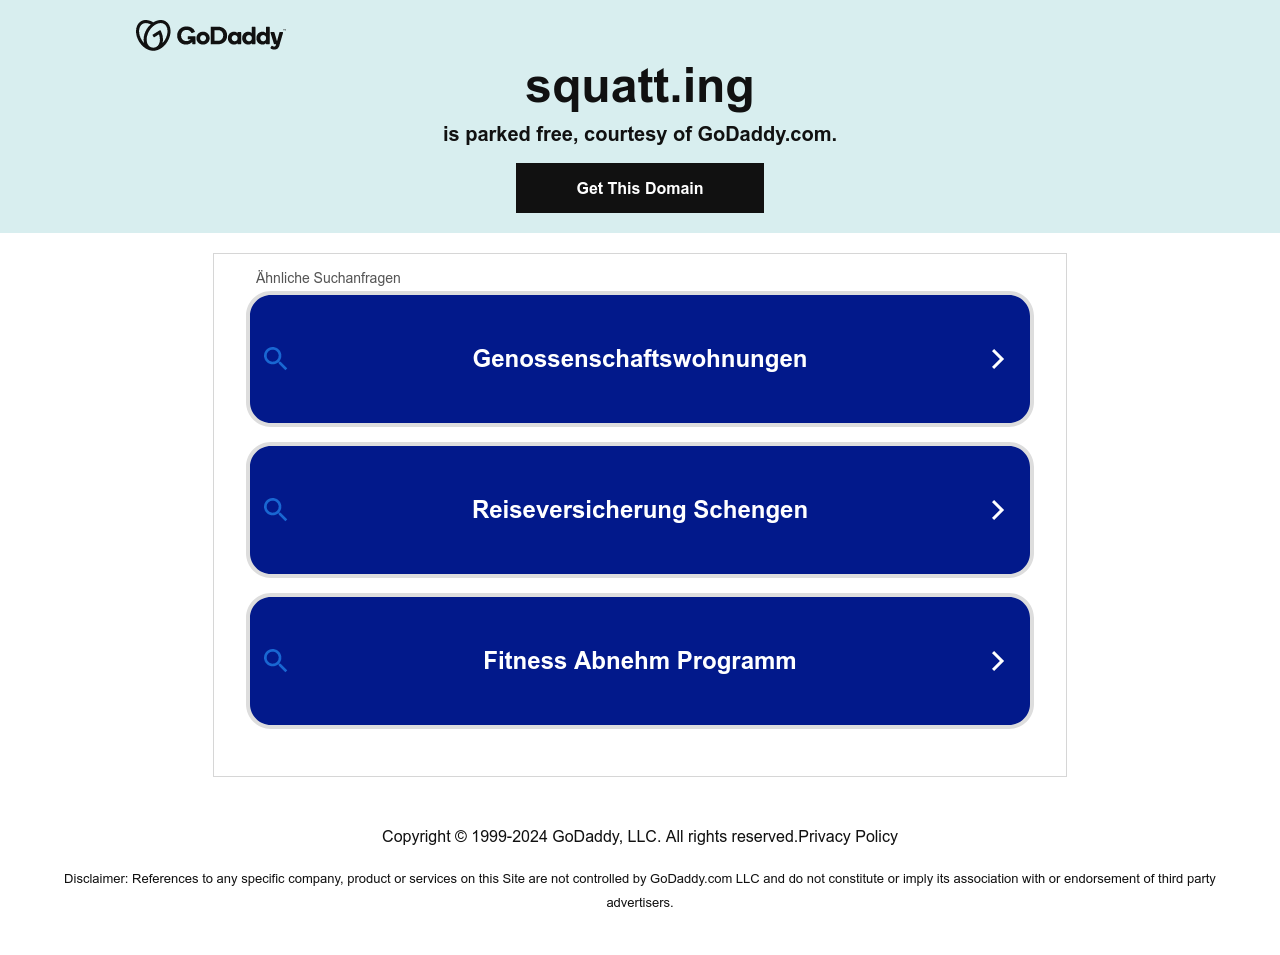
squatt.ing
The state of the .ing top level domain shortly after public release
It’s been just over two months since Google opened the floodgates holding the general public back from the .ing generic top level domain (TLD). The launch was accompanied by commentary that newer TLDs were just a cash grab and ripe for squatting, phishing and other less-than-savoury practices.
I was curious about these claims, so I spent some time scraping data from newly registered domains and performed some superficial analysis to see what they were being used for.
The Launch
The .ing TLD is particularly interesting because it is a common English verb-ending allowing for a huge number of domain hacks. Google obviously knew this, as the release followed a schedule designed to maximise their profitability. It began with a sunrise period in which trademark holders could directly register domains related to their trademarks. Following that was an early access period where anyone could register a domain for a higher-than-typical fee. The final phase was general availability beginning at 16:00 UTC on December 5th, 2023.
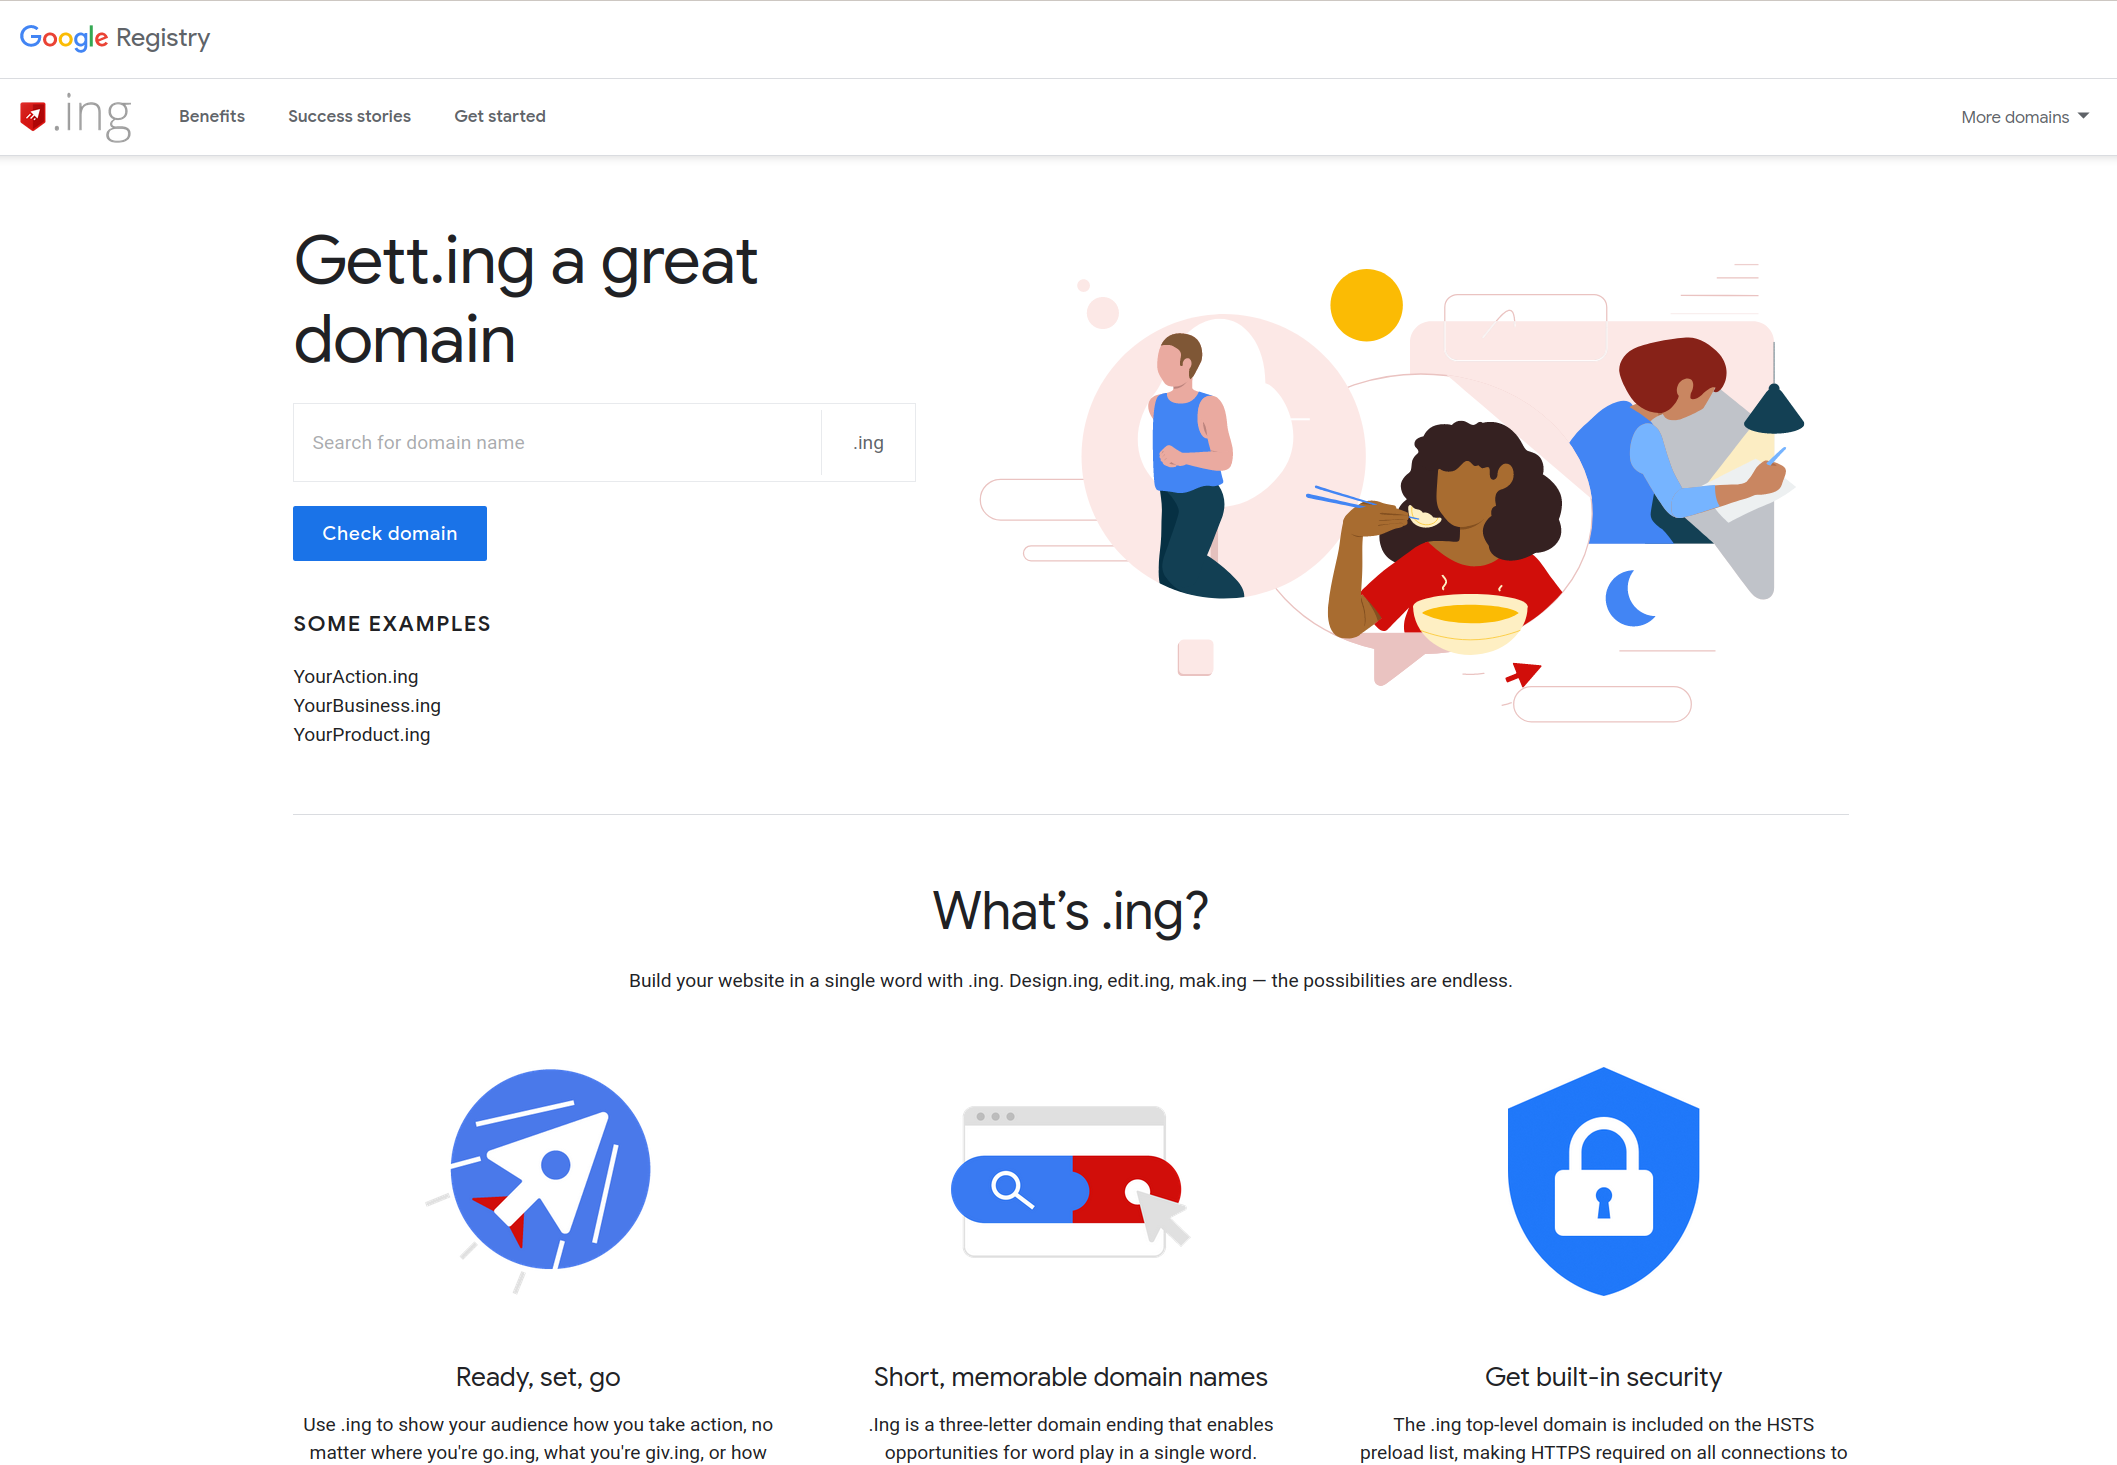
Google created a basic promotional site, get.ing for the launch. They went to some effort to ensure that well known companies like Adobe (edit.ing and sign.ing), Canva (design.ing and draw.ing) and Going (go.ing) were onboard from the beginning to lend some credibility to the new domain. Domains were available to register through 53 domain registrars, of which 19 were listed as “preferred providers” at Google Registry. Weirdly, a different set of 18 registrars were promoted on the get.ing launch page.
Although the pricing structure of the sunrise and early access periods wasn’t public knowledge, it should be noted that the pricing of domains now (general availability) is dependent on the name being registered. Regular domains cost €23.86 per year from Gandi. Premium domains seem to start from €68.88 (livesav.ing) through €3 078.60 (party.ing), €30 784.48 (cod.ing) all the way up to €102 614.56 (sell.ing) per year.
Acquiring Data
I wrote some code that took an English language wordlist and stripped it down to every word with an -ing suffix. From there, I scraped data on all of the valid domain hacks that could be registered using the new .ing TLD, including:
- Prices for registration, transfer and renewal
- WHOIS data
- DNS records
- HTTP responses
- Website screenshots
A first scraping run for everything except pricing was started at 2024-02-05T15:32:22Z and ended around 14 hours later. It was acquired on my laptop connected to the internet via a residential internet provider in Luxembourg. I performed a second scraping run to grab pricing data 9 days later from a hotel in Tunisia. I have uploaded the entire dataset here, along with the scraper log file. In total, 18 118 English words were tested.
Some Analysis
Pricing and Status
So what does the price distribution of the domains look like? How many English language domains are in each price bracket? Has the premium pricing discouraged people from squatting? What is the state of each domain?
At least for Gandi, renewal, transfer or registration for each domain is 1 of 12 unique prices. These price points roughly follow an exponential curve. The large majority (81%) of domains sit at the second price point (index 1) at the standard price of €23.86 per year.
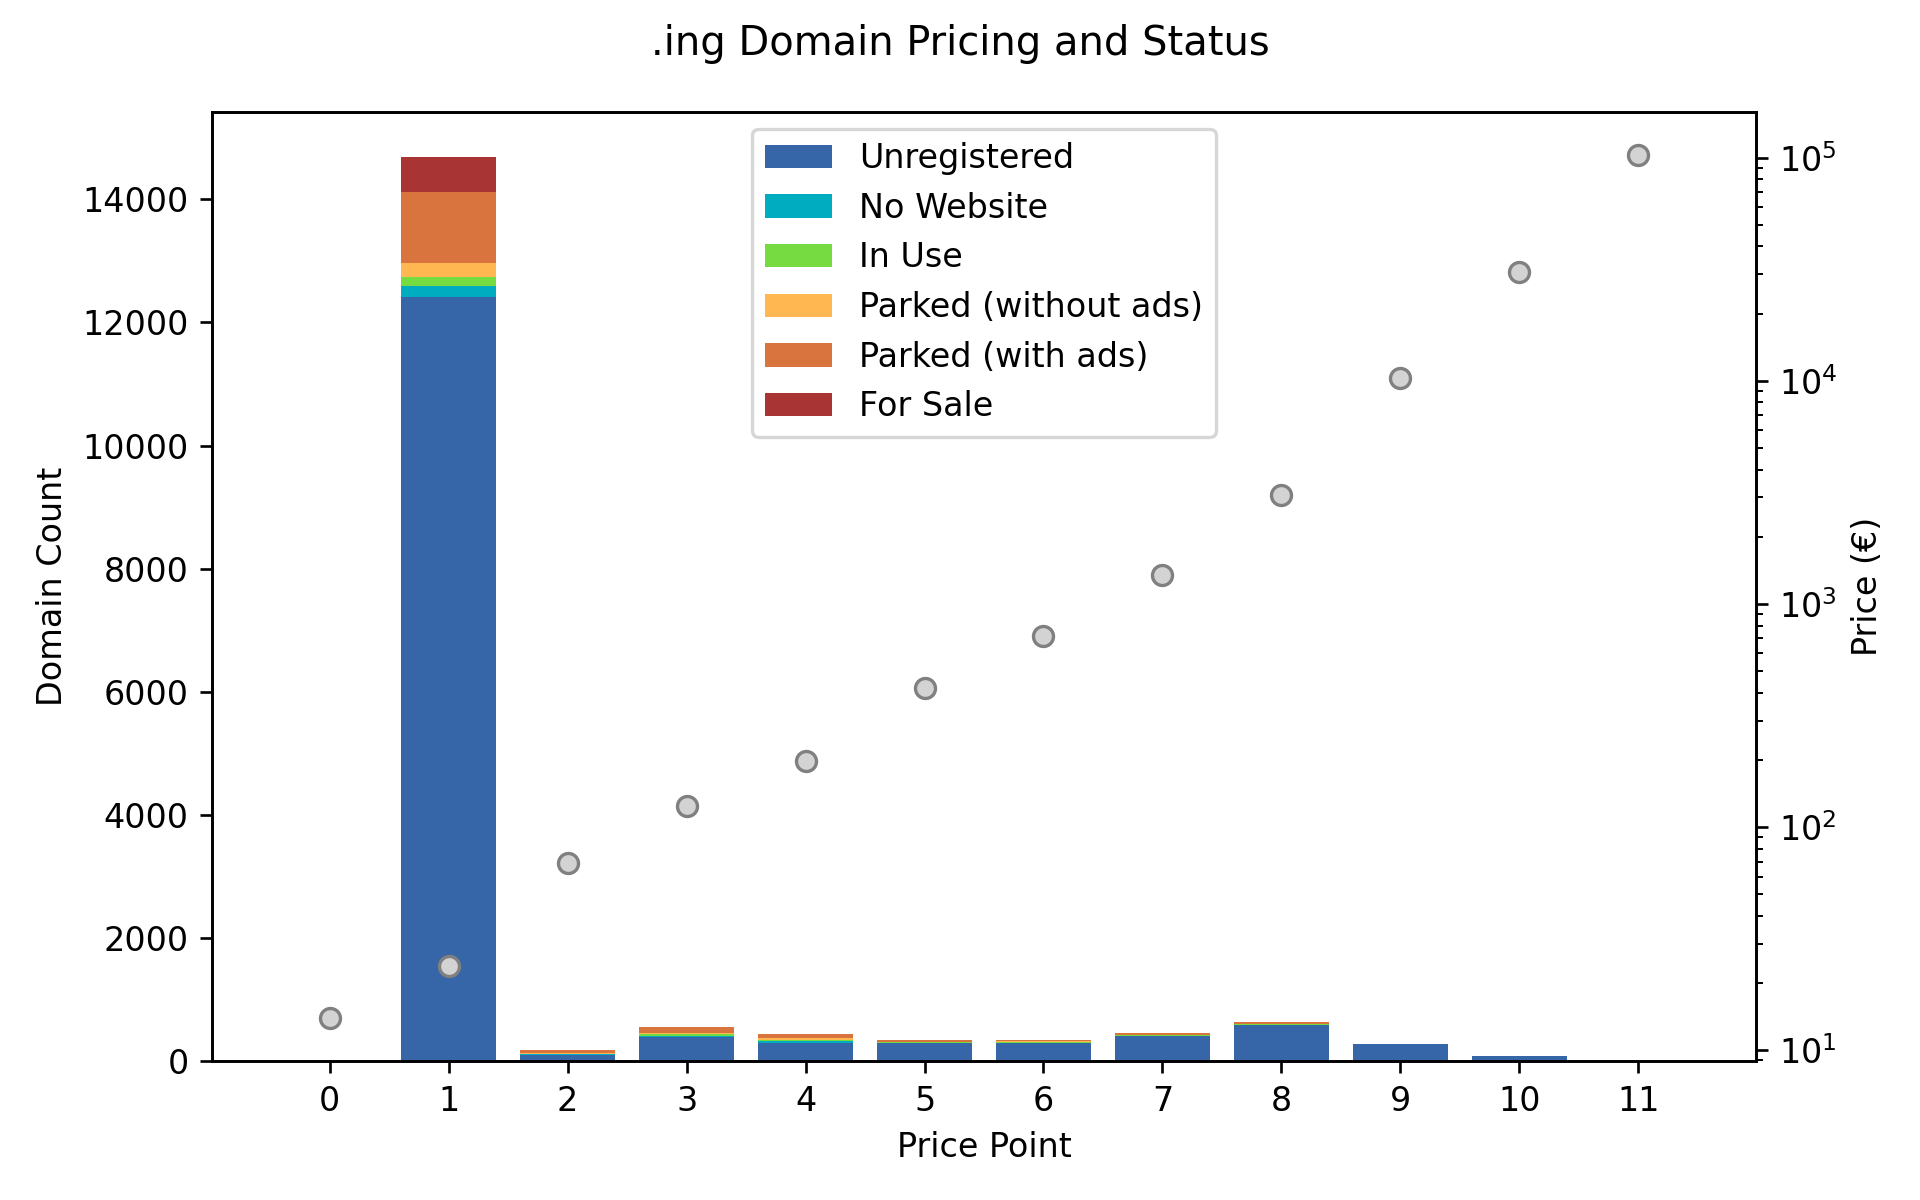
You’ll notice in the plot above, that I’ve also categorised the status of the domains based on usage. It’s done based on a set of very rudimentary rules looking at page content and the final URL a browser is redirected to after visiting the page. It’s likely the rules won’t work from other geolocations, but I verified them based on screenshots acquired at the same time, and they seem fairly accurate.
An explanation of each status:
- Unregistered: Still available for registration at the time of the scraping run, no WHOIS data yet.
- No Website: Registered to someone, but as of yet not serving any sort of HTTP request. Note, the scraping run hit
http://name.ing/endpoints (no TLS, nowww.prefix) only, assuming that sensible sites would have redirects. If redirected to a TLS endpoint, it actively ignored any TLS certificate errors. - In Use: A registered domain with a genuine website being served.
- Parked (without ads): A domain currently serving a generic parking page without any advertising on it.
- Parked (with ads): A domain serving a generic parking page containing advertising.
- For Sale: A domain that was registered and is being actively marketed for sale. Registrars serve a variety of different pages ranging from a subtle “this domain may be for sale, please contact us” through to outright bidding forms.
Of the registered domains, it’s clear that many are sitting idle with advertising on them or are being resold. Let’s zoom in vertically a bit to see how many domains are in the higher price categories.
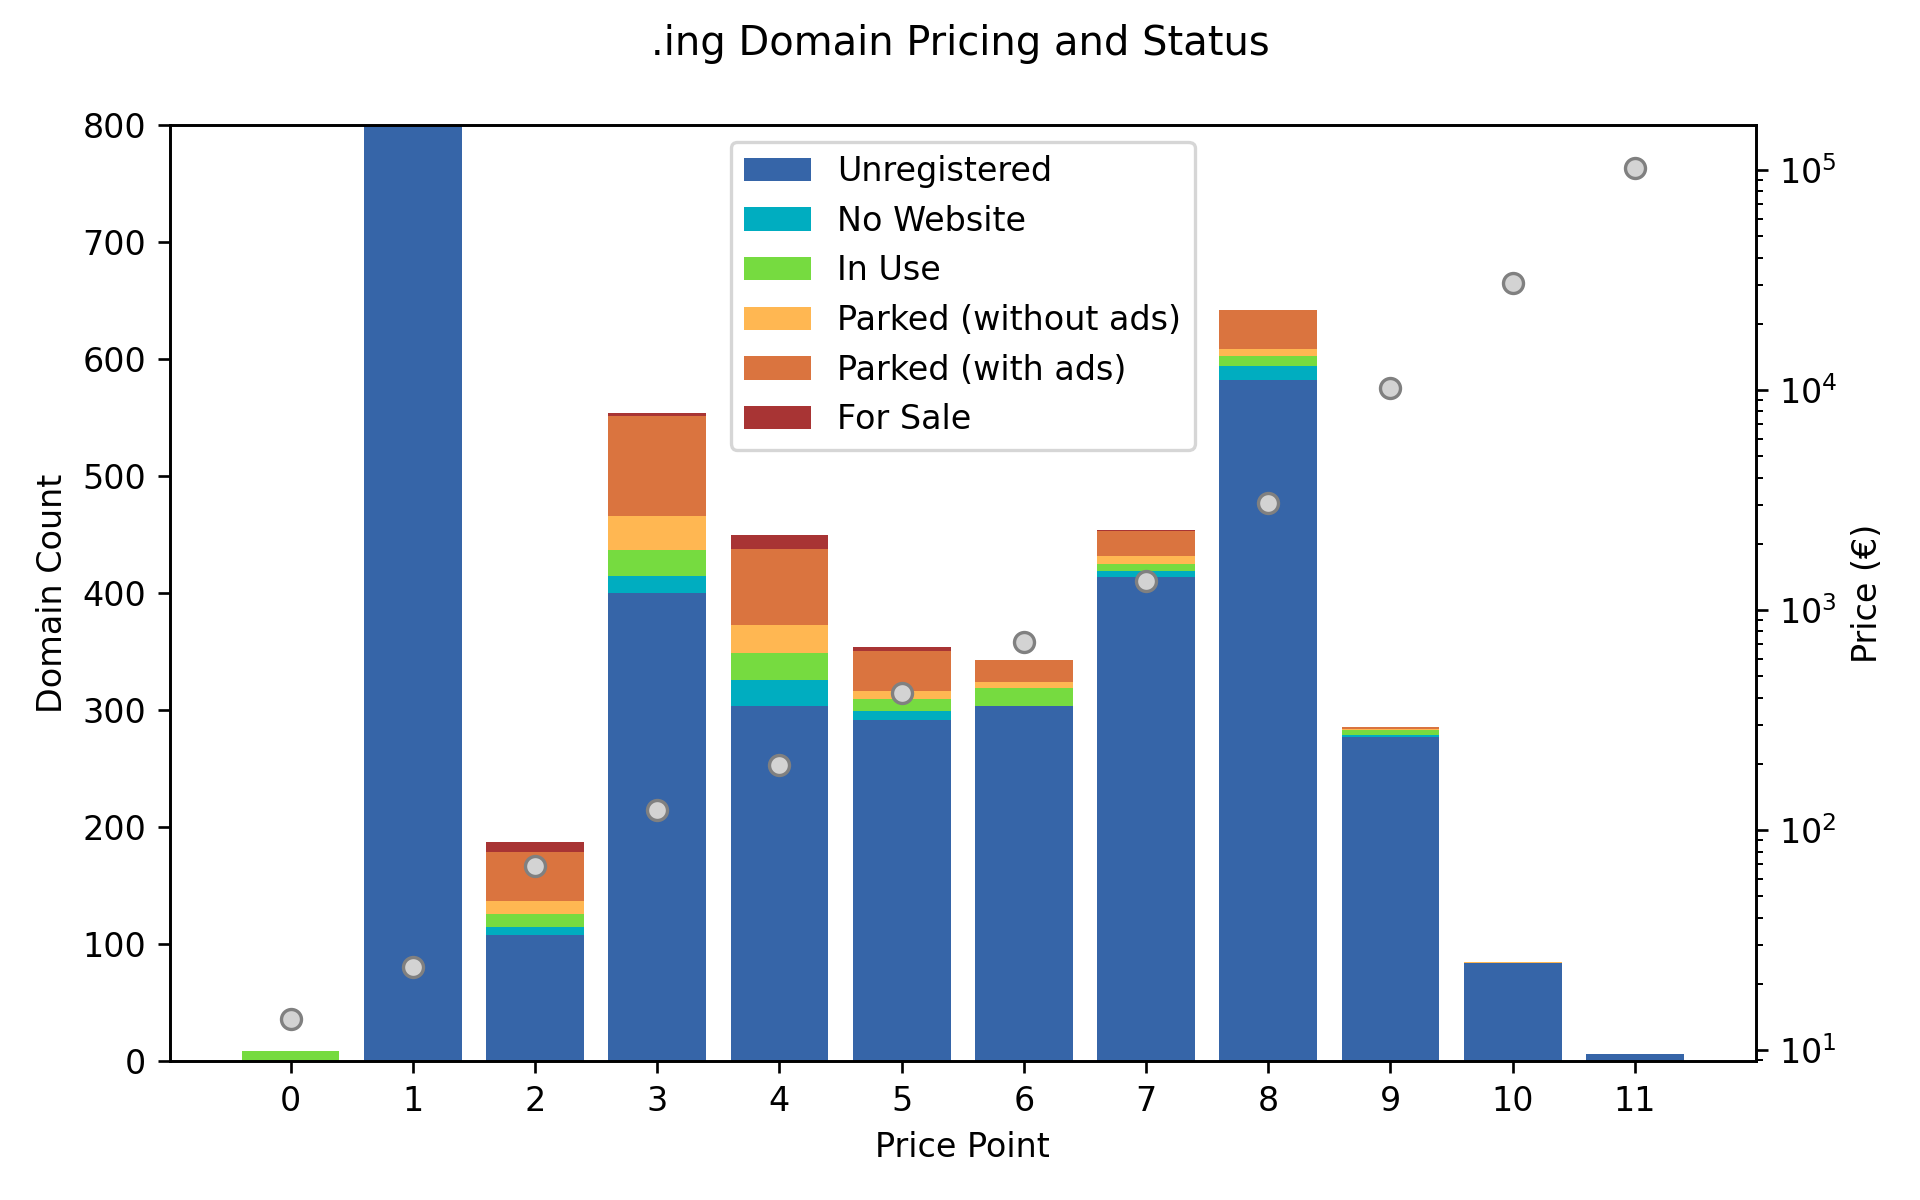
The domain count at higher price points follows a strange distribution, although they are all roughly the same order of magnitude with the exception of the highest price point. I suspect this distribution is affected by how common and short a word is in English, as well as how lucrative a related market segment might be. It’s no coincidence that the 6 digit pricing applies to buy.ing, fly.ing, pay.ing, play.ing, sell.ing and work.ing.
Has the higher pricing for premium domains managed to dissuade domain squatting and trading? To better investigate, it’s worthwhile normalising the domain counts and presenting them as percentages.
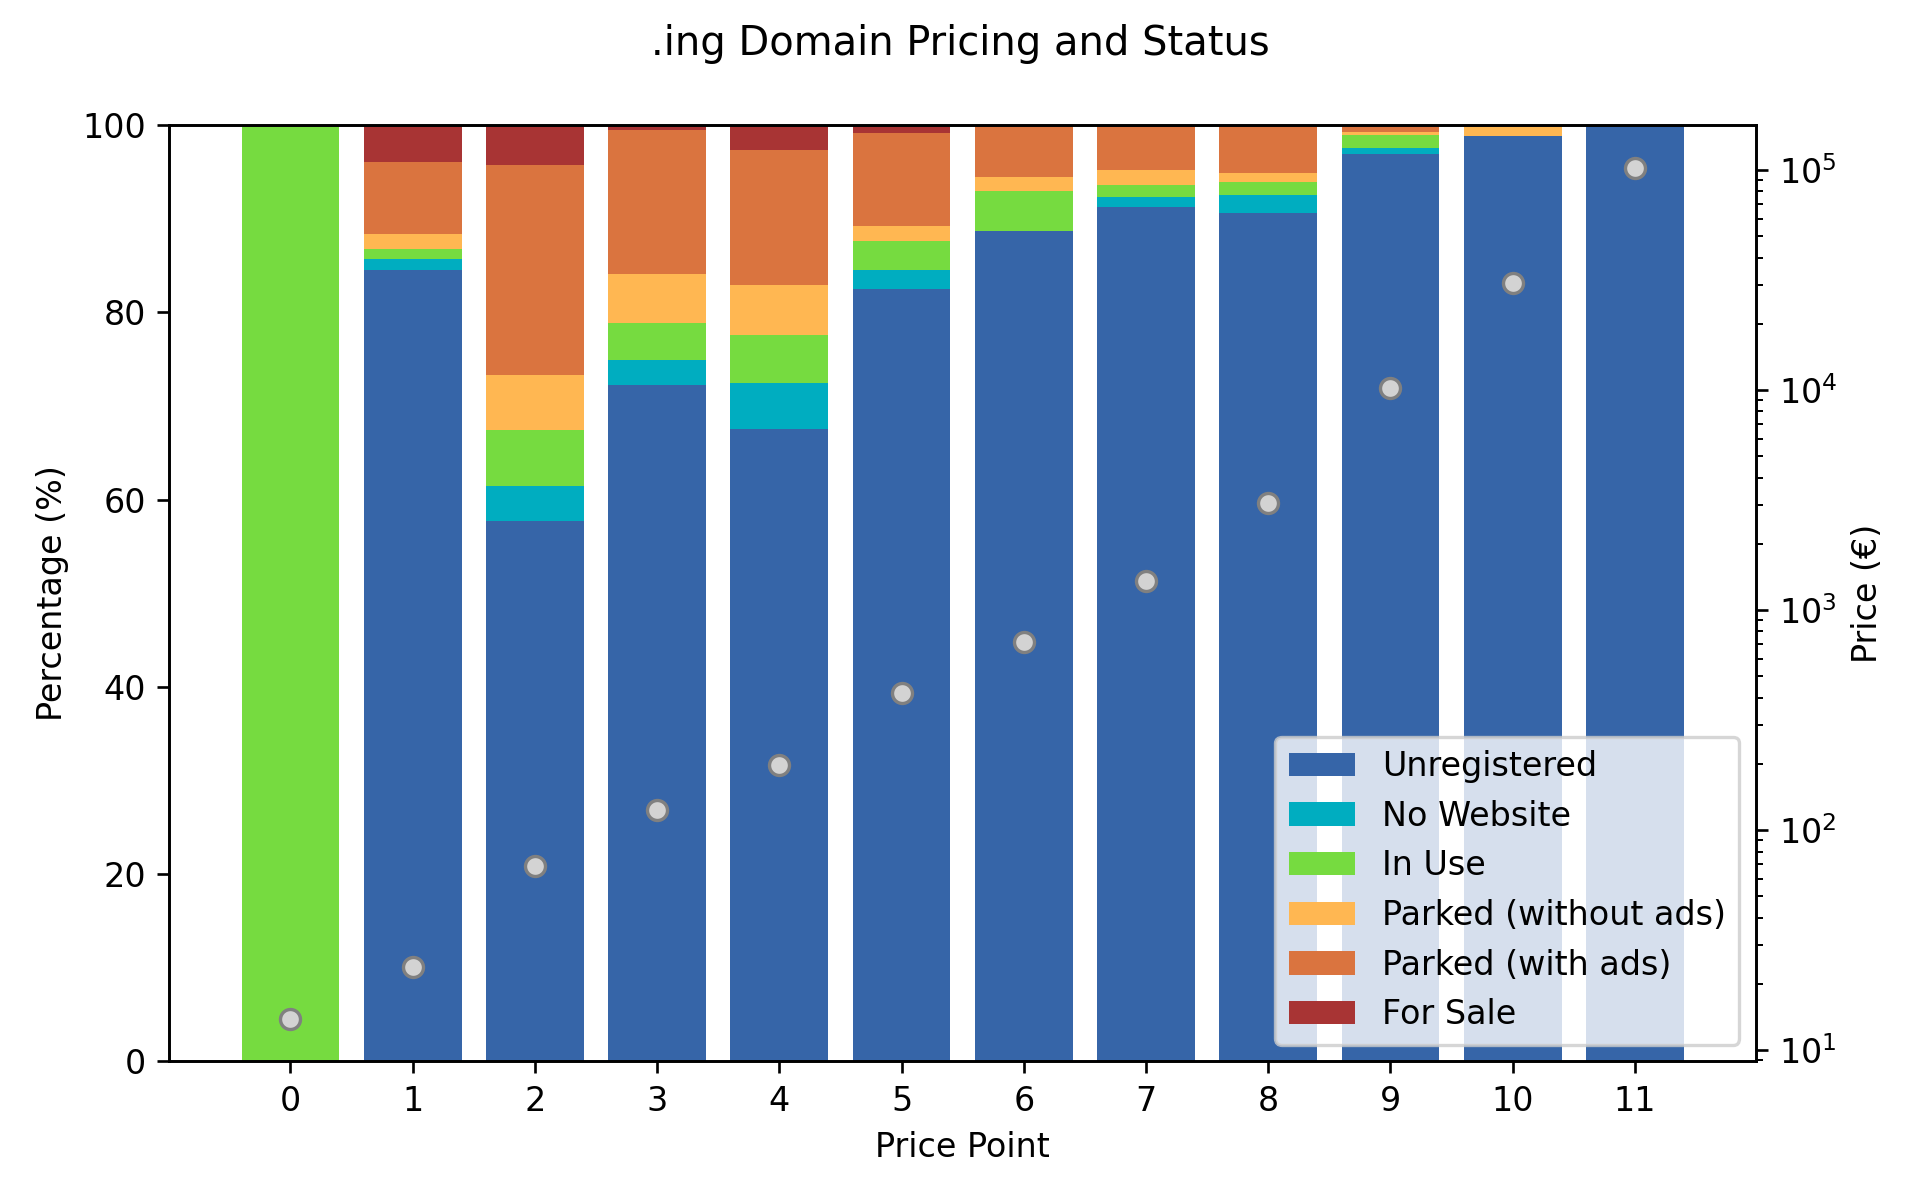
It looks like it has. Not only does the fraction of domains registered decrease at higher price points, the fraction of parked/squatted domains compared to total registered domains also has.
You might be wondering what the deal with the 0th price point is, why there are so few domains and why they’re all in use. From what I can see, these 9 domains all belong to companies involved in the prerelease promotion of the .ing TLD. They’re priced at €13.91 for a transfer or renewal.
Registration Rush
It’s worthwhile having a bit of a look at the timeline of registrations of .ing domain. Below is a plot of the timeline of all registered domains. Do note, the vertical axis is scaled logarithmically.
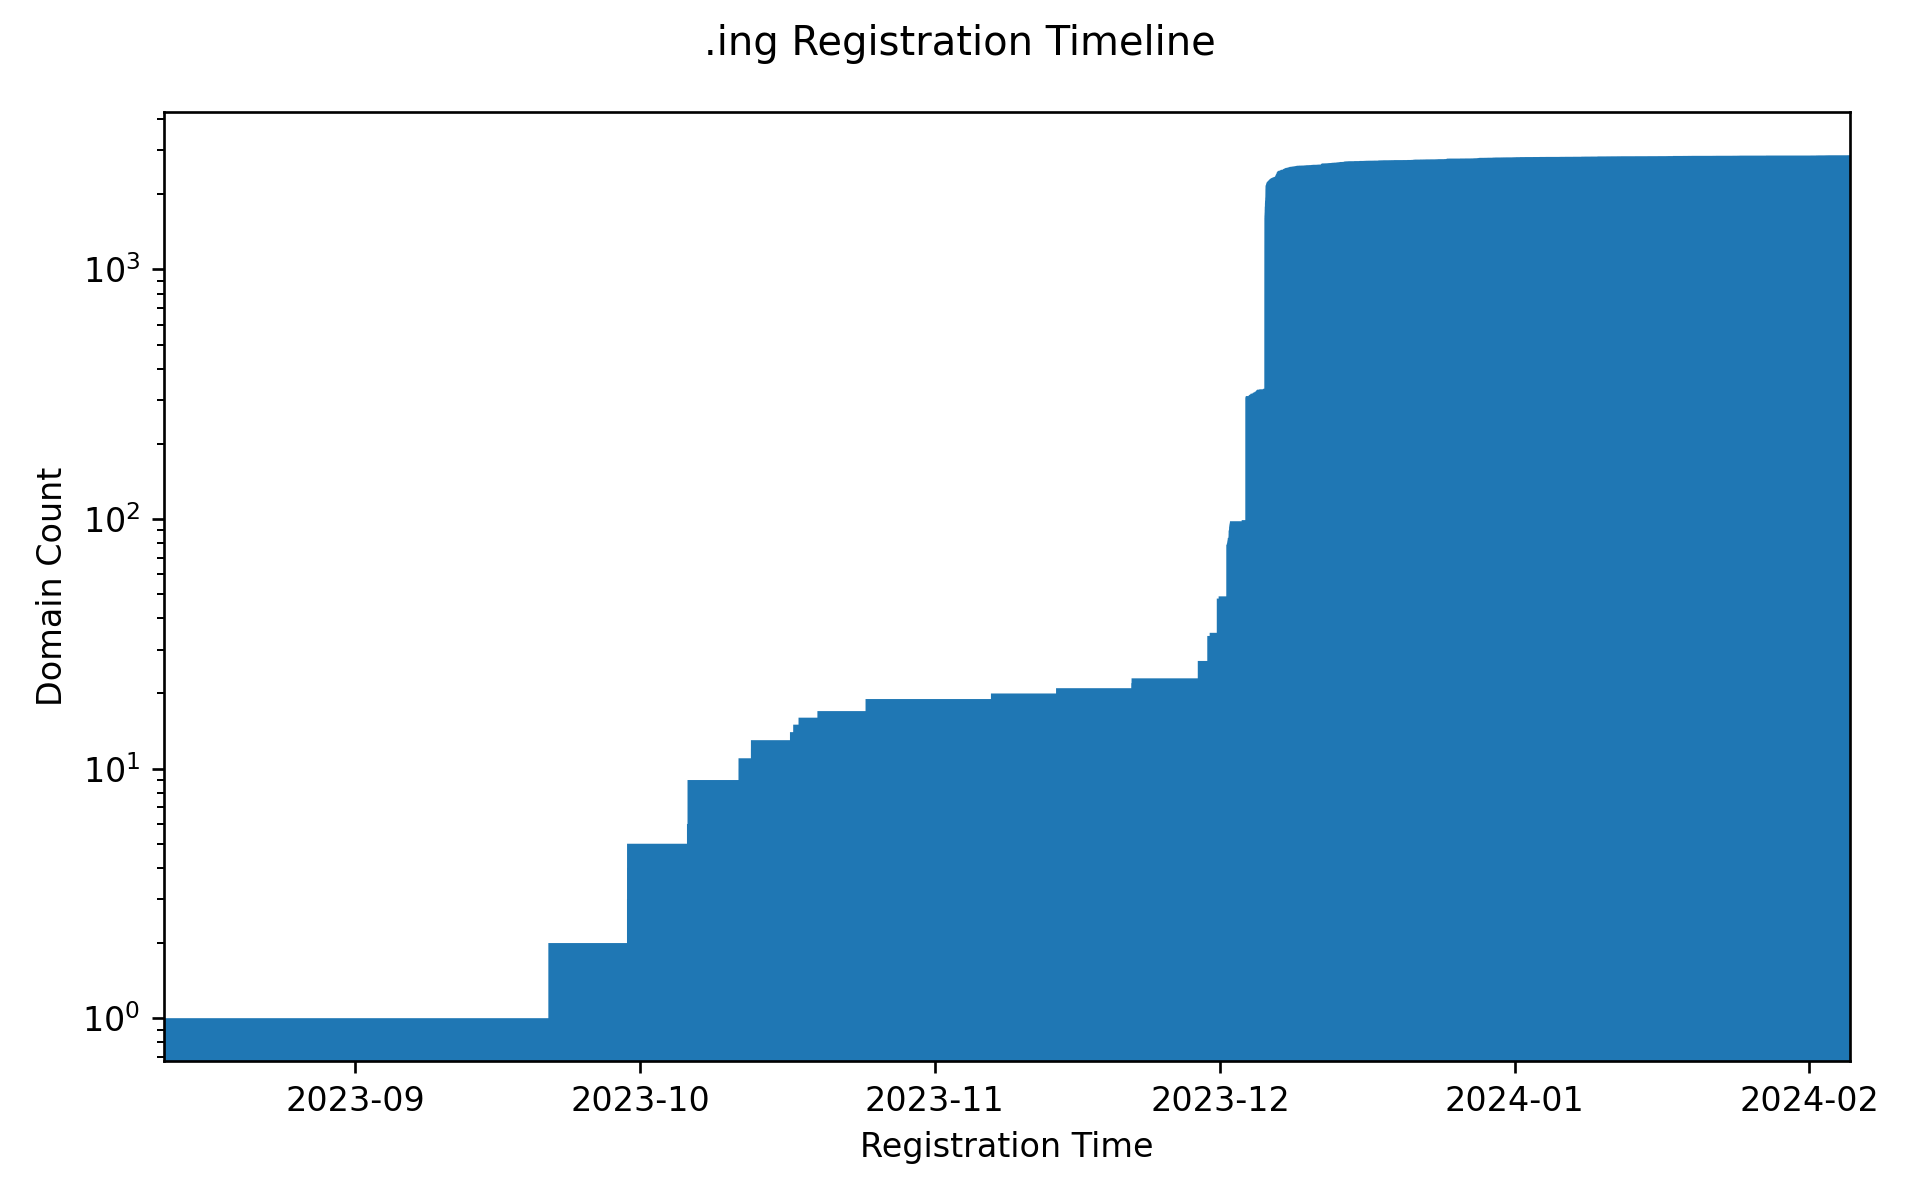
The earlier steps are caused by discretisation of the domain count, but the later steps show that huge quantities of domains were registered in a short period of time in early December 2023. Breaking this down by the state of each domain gives the following plot.
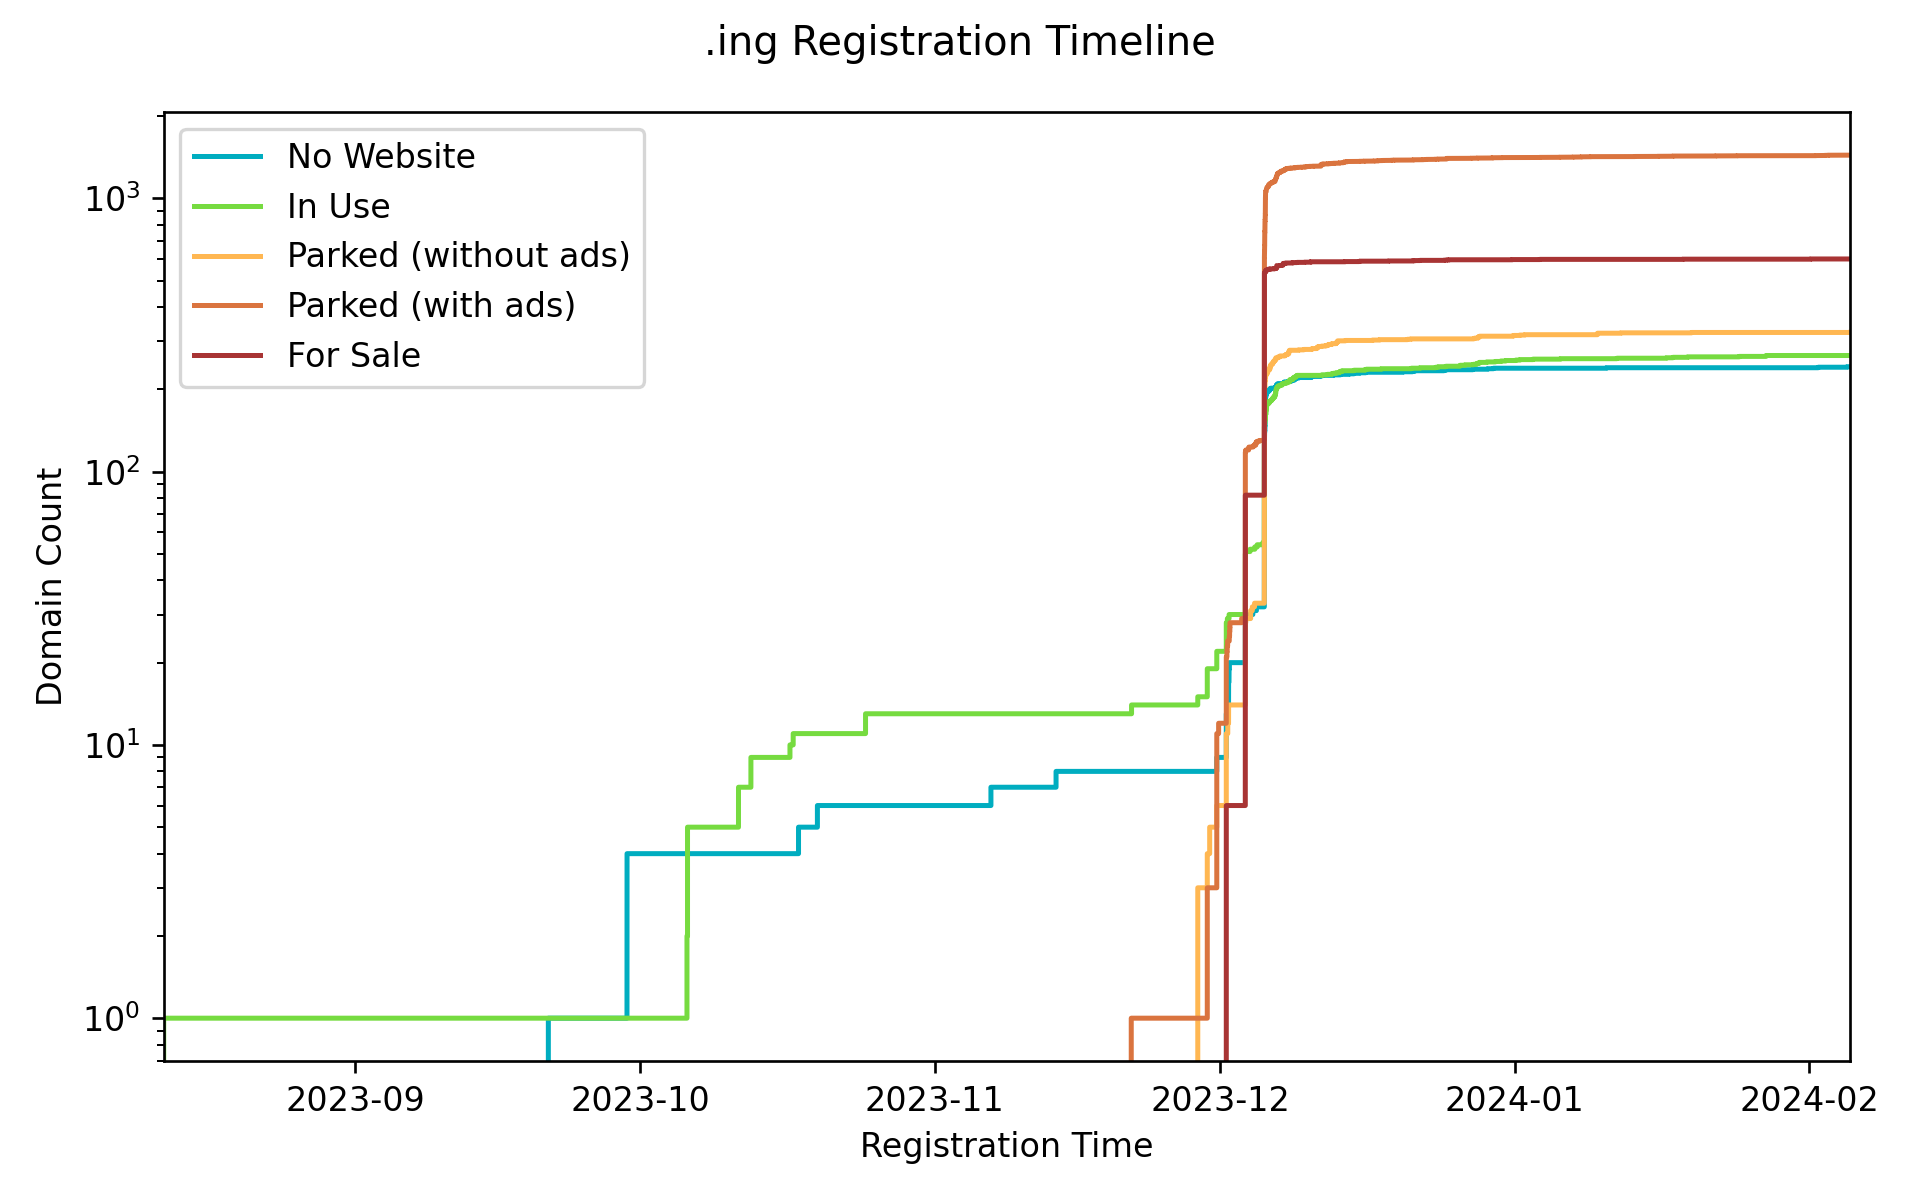
The plot shows that the majority (82%) of domains that were registered are now parked and/or for sale. This strongly indicates that they were registered opportunistically in the hope of a future windfall. We can visualise this even better by plotting registration rates immediately after the TLD became generally available at 16:00 UTC on 2023-12-05.
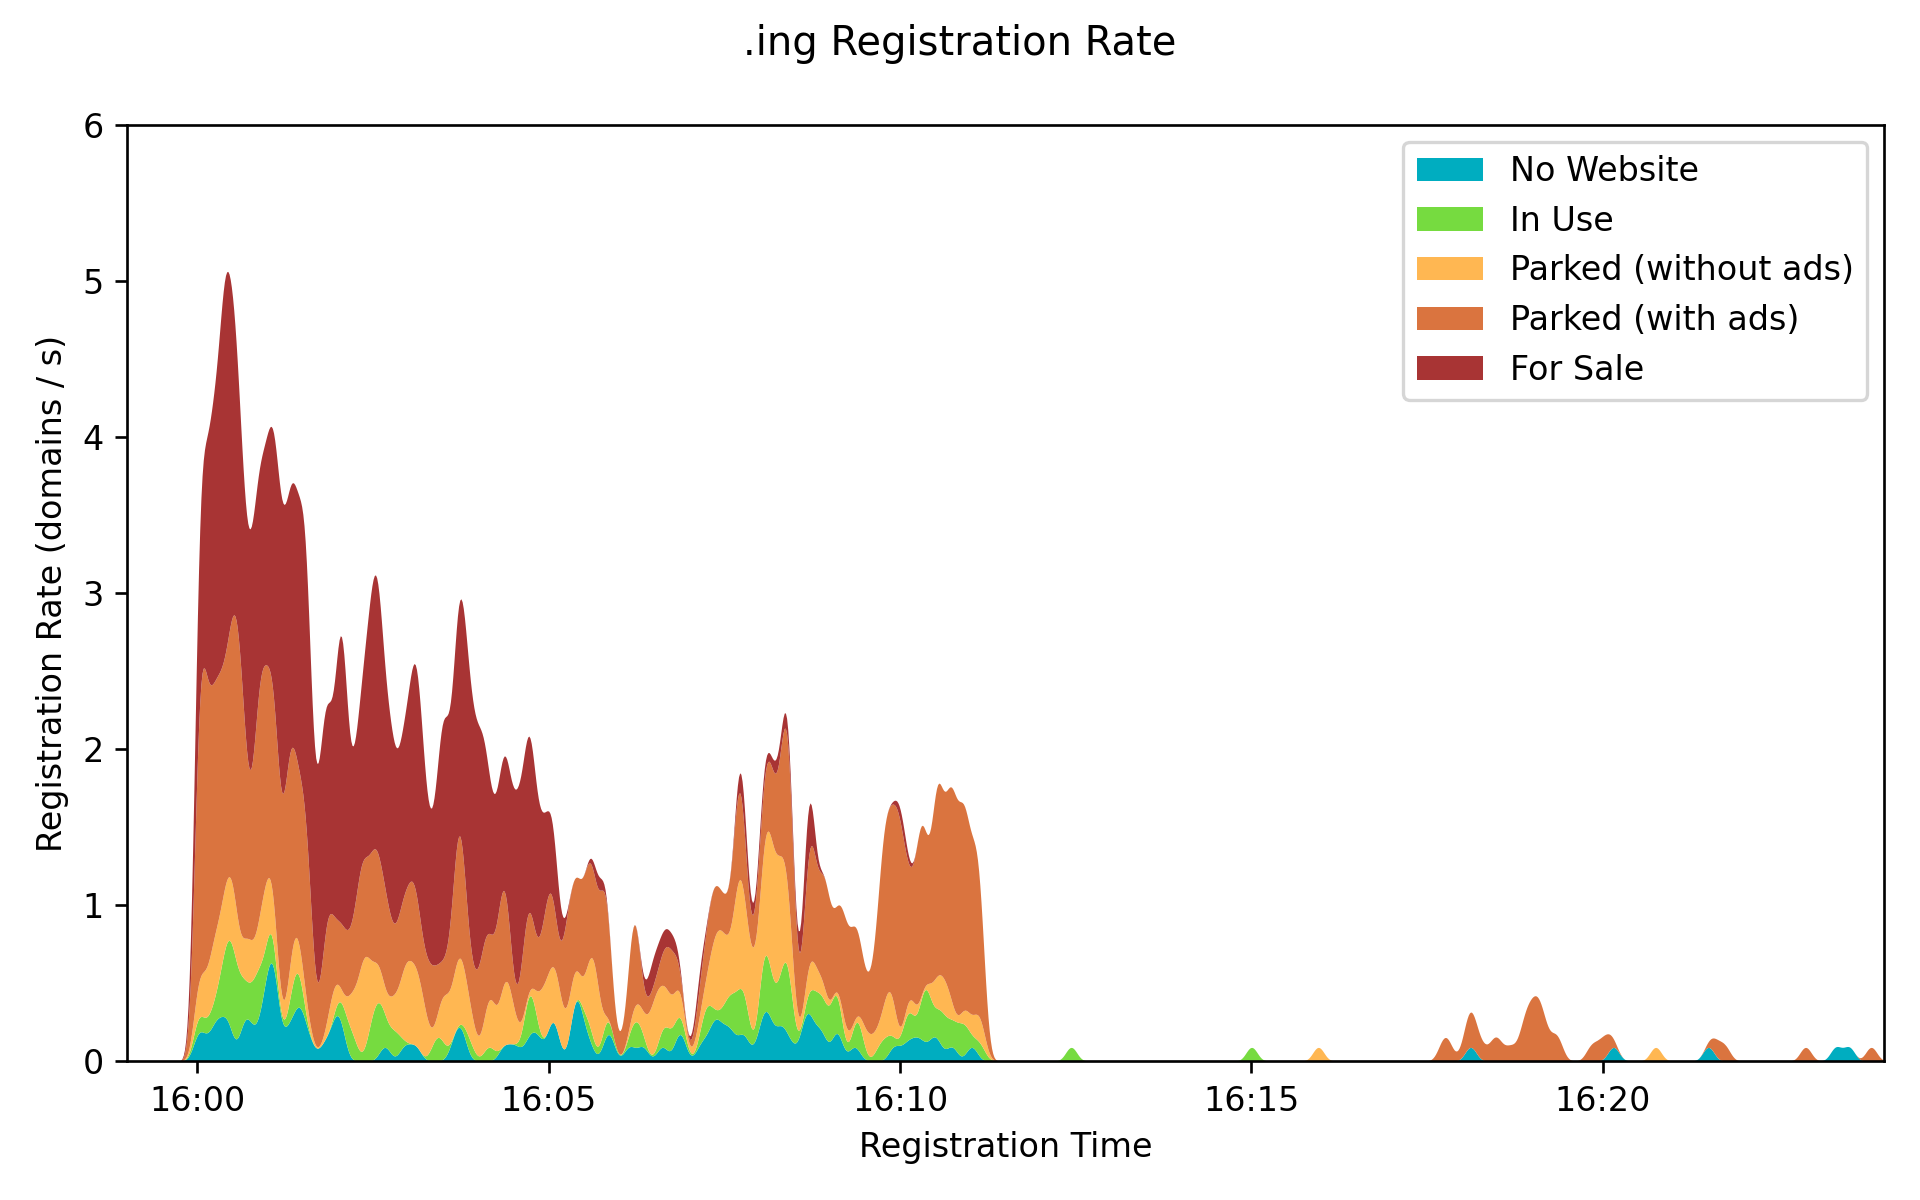
The plot above is a stacked area plot, and has been smoothed to provide a more continuous curve. It clearly shows the influx of registrations at release time, likely from bots and people prepared with a list of domains they wanted to snag. It’s particularly interesting that the majority of the domains that are now for sale were registered in the first 5 minutes, accounting for 431 domains out of the 600 for sale at the time of scraping.
The initial rush appeared to mostly stop around 16:12, with a long tail of further registrations trickling in afterward. Registrations during those initial 12 minutes account for 45% (1275 of 2871) of domains registered at the time of scraping, with the tail accounting for a further 44%.
The Untouchables
There were a handful of domains that behaved peculiarly during scraping:
- Any single or double letter domains appeared to be off-limits, along with the domain gett.ing (a variant of the launch get.ing?). For these domains, the response from the Gandi API was mostly empty. Strangly, some of these returned WHOIS results, meaning they were actually registered, including ap.ing, gett.ing, go.ing, th.ing and w.ing.
- Some domains had no WHOIS results, but the Gandi API returned a response with a status of “pending”. On further checking, these domains still have no WHOIS results, meaning that although they were “pending”, the registration was never finalised. nonreflect.ing, taxi.ing, unloos.ing and upcom.ing all fall into this category.
- The domain sham.ing had no WHOIS results, and caused the Gandi API to return a HTTP 400 error. This may have been a transient error.
Conclusion
It’s apparent that at least some of the concerns of the .ing TLD being ripe for squatting and a general cash grab by Google are founded in truth. Looking at the data shows a very large percentage of initially registered domains corresponding to English -ing words are parked and either hosting advertising, or actively for sale. The rate at which these were registered also indicates that the squatters were ready for the release, with large numbers of squatted domains registered in the first few minutes of availability.
The most ironic thing? Even the domain squatt.ing was taken an hour-and-a-half after becoming available. And this is what it’s currently serving.